How we designed the user interface for an enterprise analytical system
Read a case study on how we created a data-driven UI/UX design and also developed a web-based interface for the equipment monitoring system.
We are particularly interested in developing projects in the industrial sector. Industrial workers see the interfaces of such projects every day, as it is their main working tool. Human machine interface (HMI) design influences work habits, daily routines, and productivity.
The task
In 2021, we were contacted by an industrial plant that was faced with the need to create a system for analyzing processes in its production. The enterprise team studied ready-made solutions, but none of the analytics system designs fully covered the required functionality. So they turned to Evrone with a request to develop their own analytical system that would collect data from all machines and allow it to be analyzed to see bottlenecks in production. For this project, we created a data-driven UI/UX design and also developed a web-based interface for the equipment monitoring system.
Solution
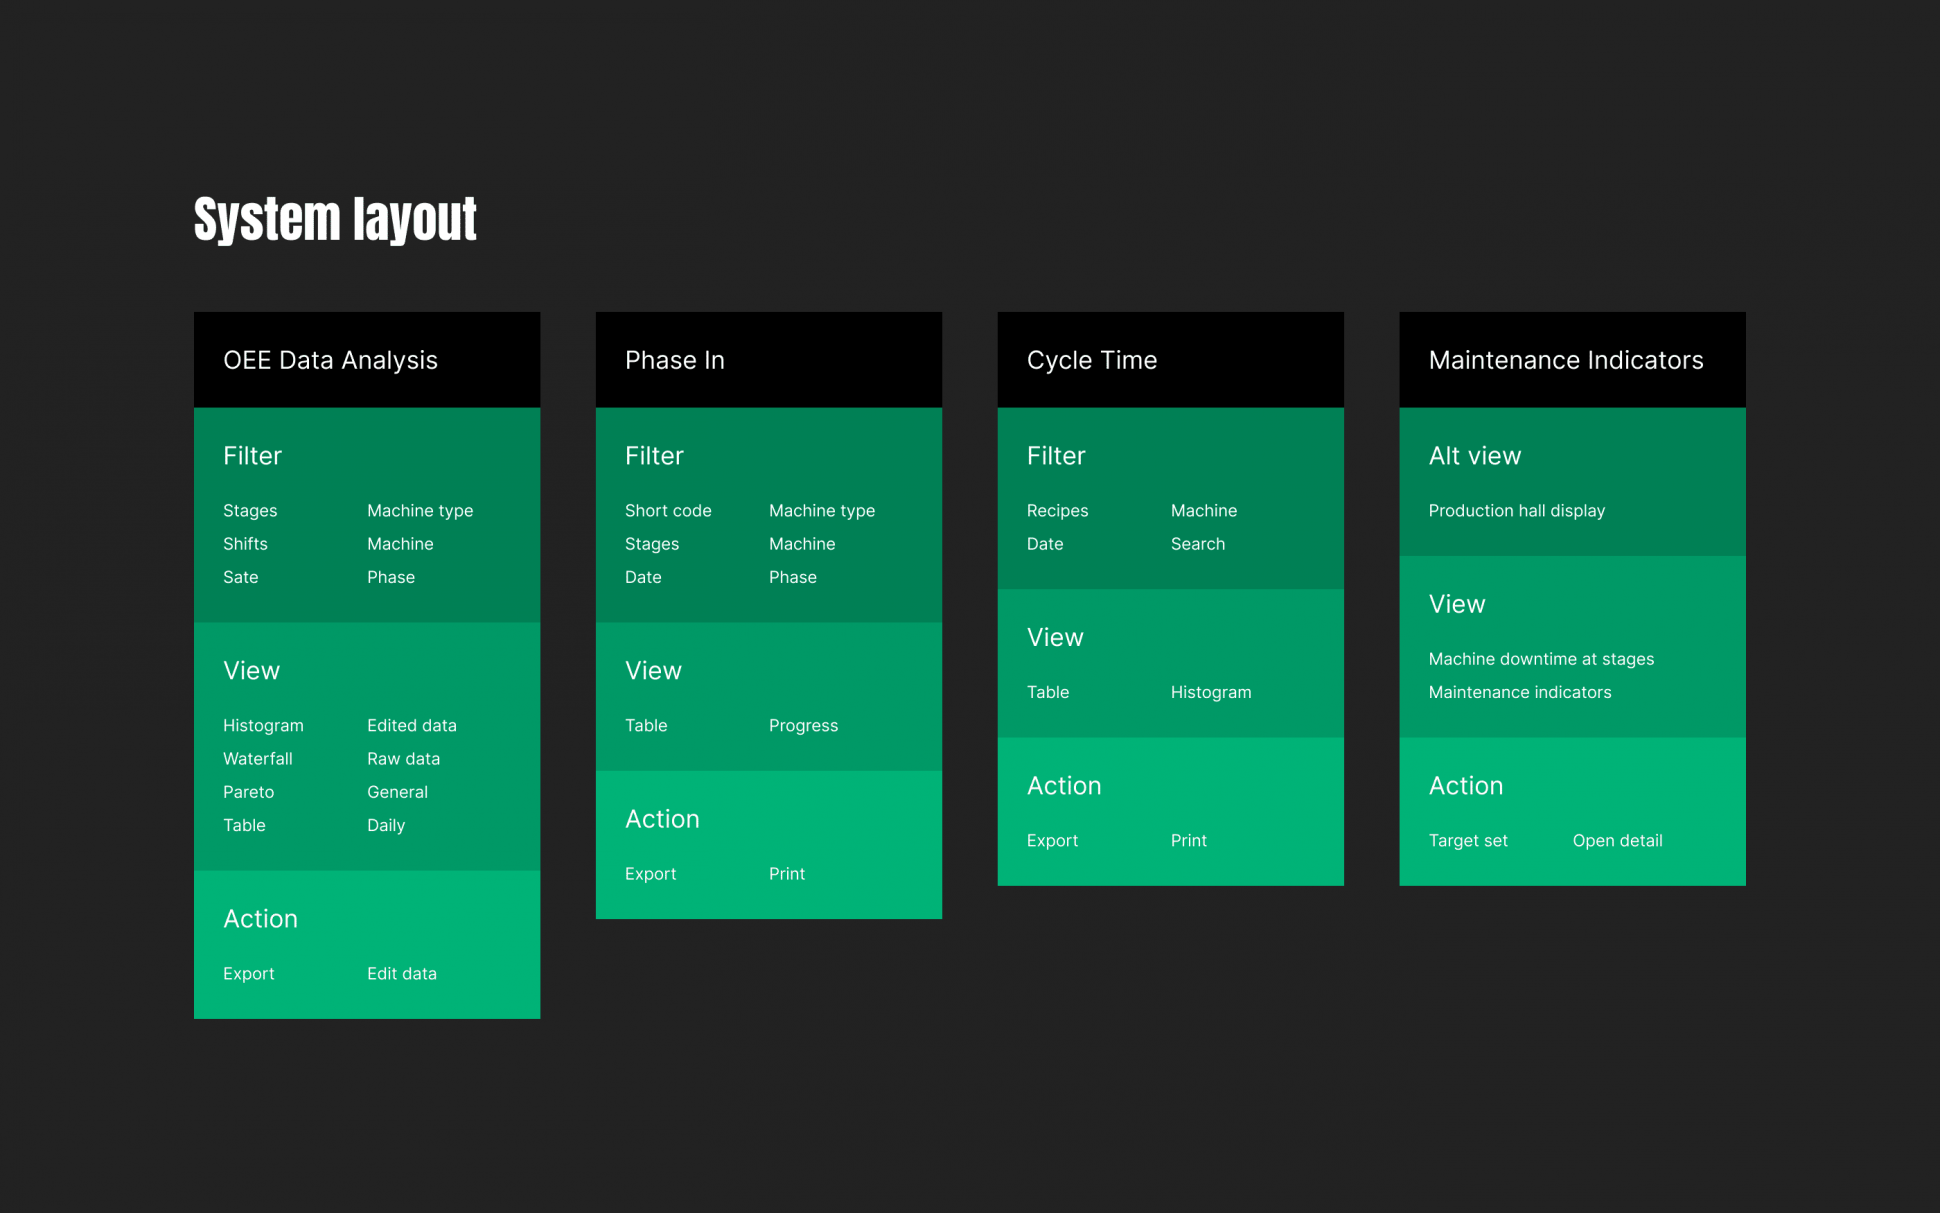
The data-informed design of the system already helps the plant team with their daily tasks, including:
- Analyzing the efficiency of the entire enterprise: quantity of goods produced, problem solving expenses, earnings, etc.
- Navigating the status of specific characteristics in production, without interacting with the machines.
- Controlling the process of working with the production recipe.
- Seeing which machines are currently down and reducing downtime.
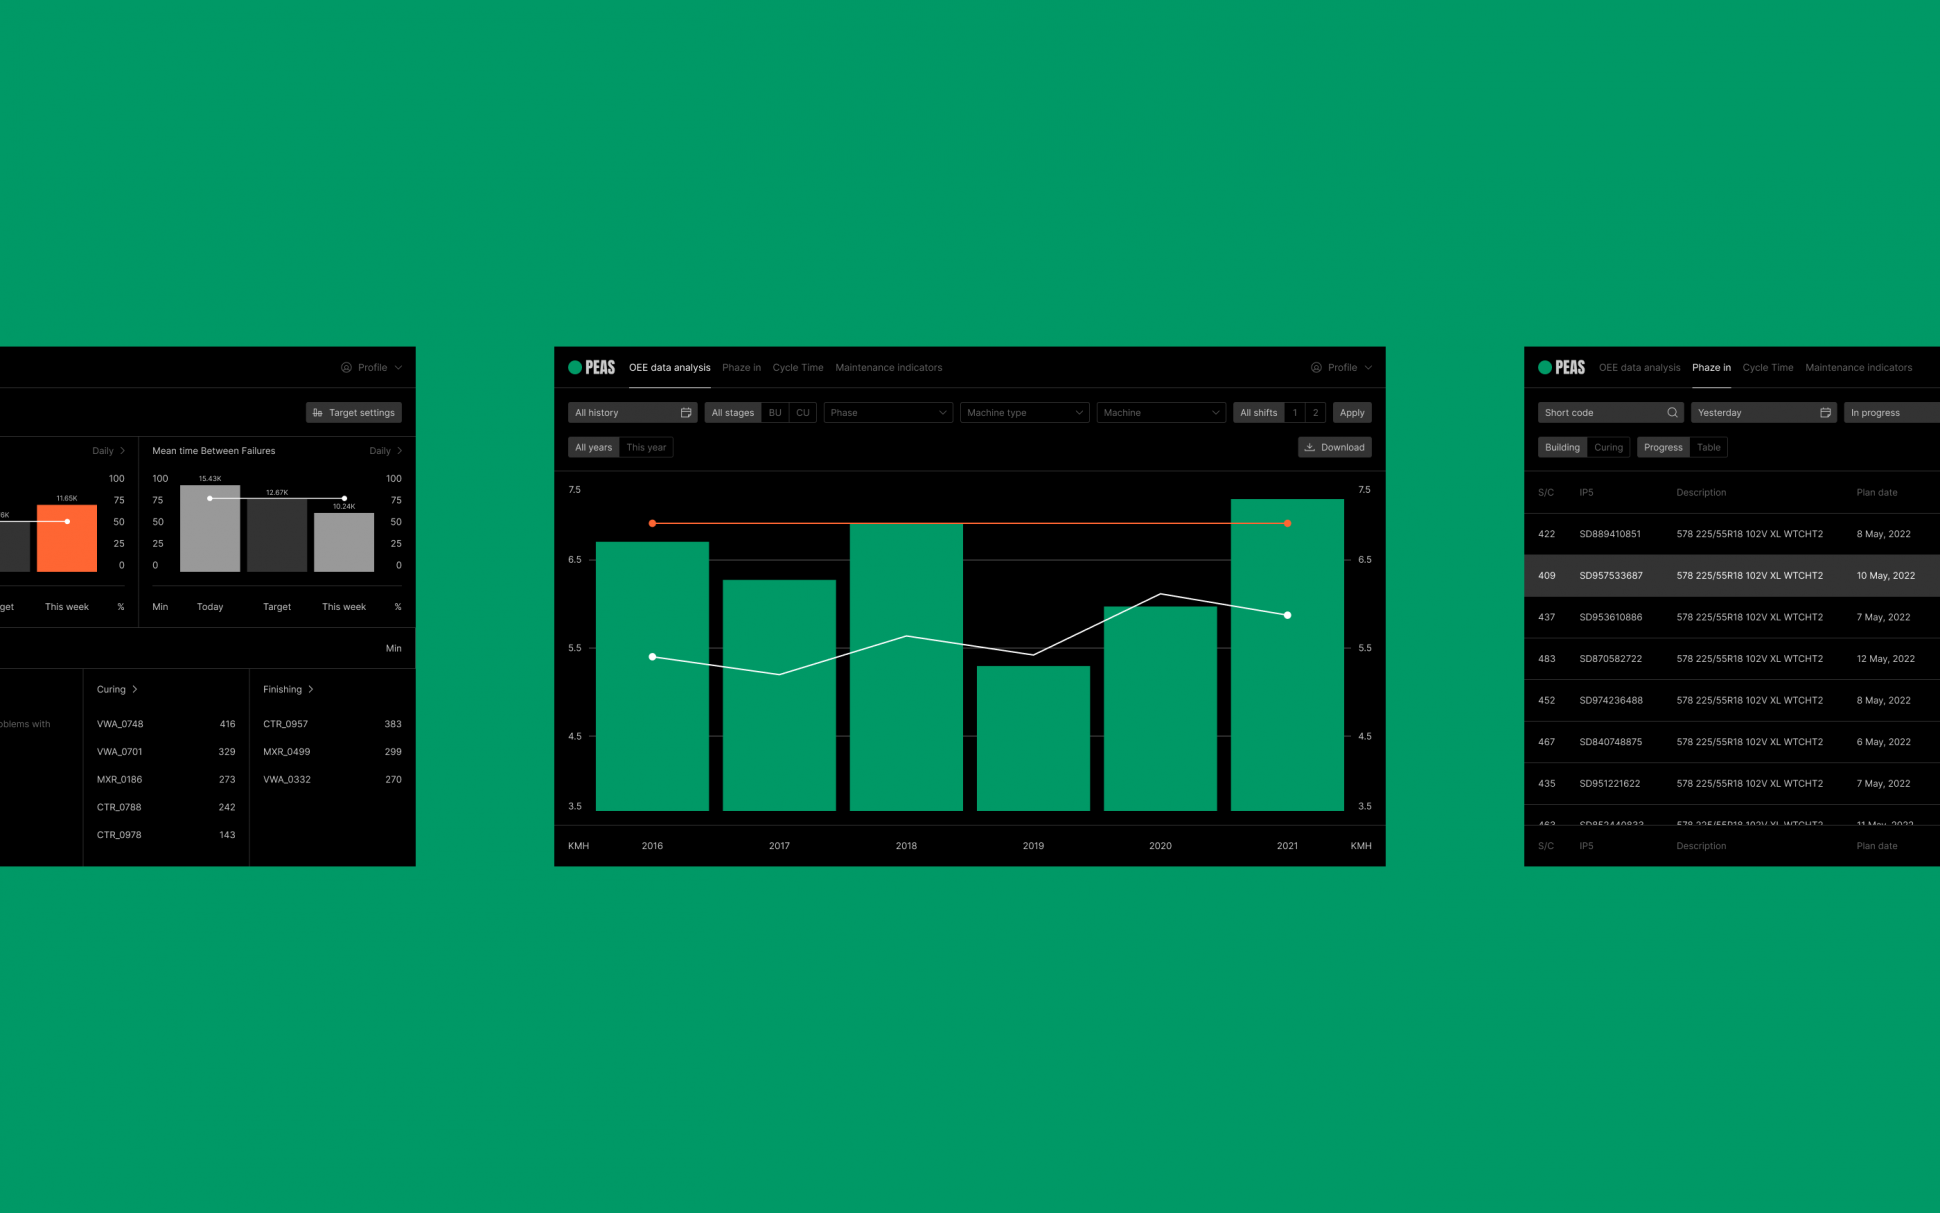
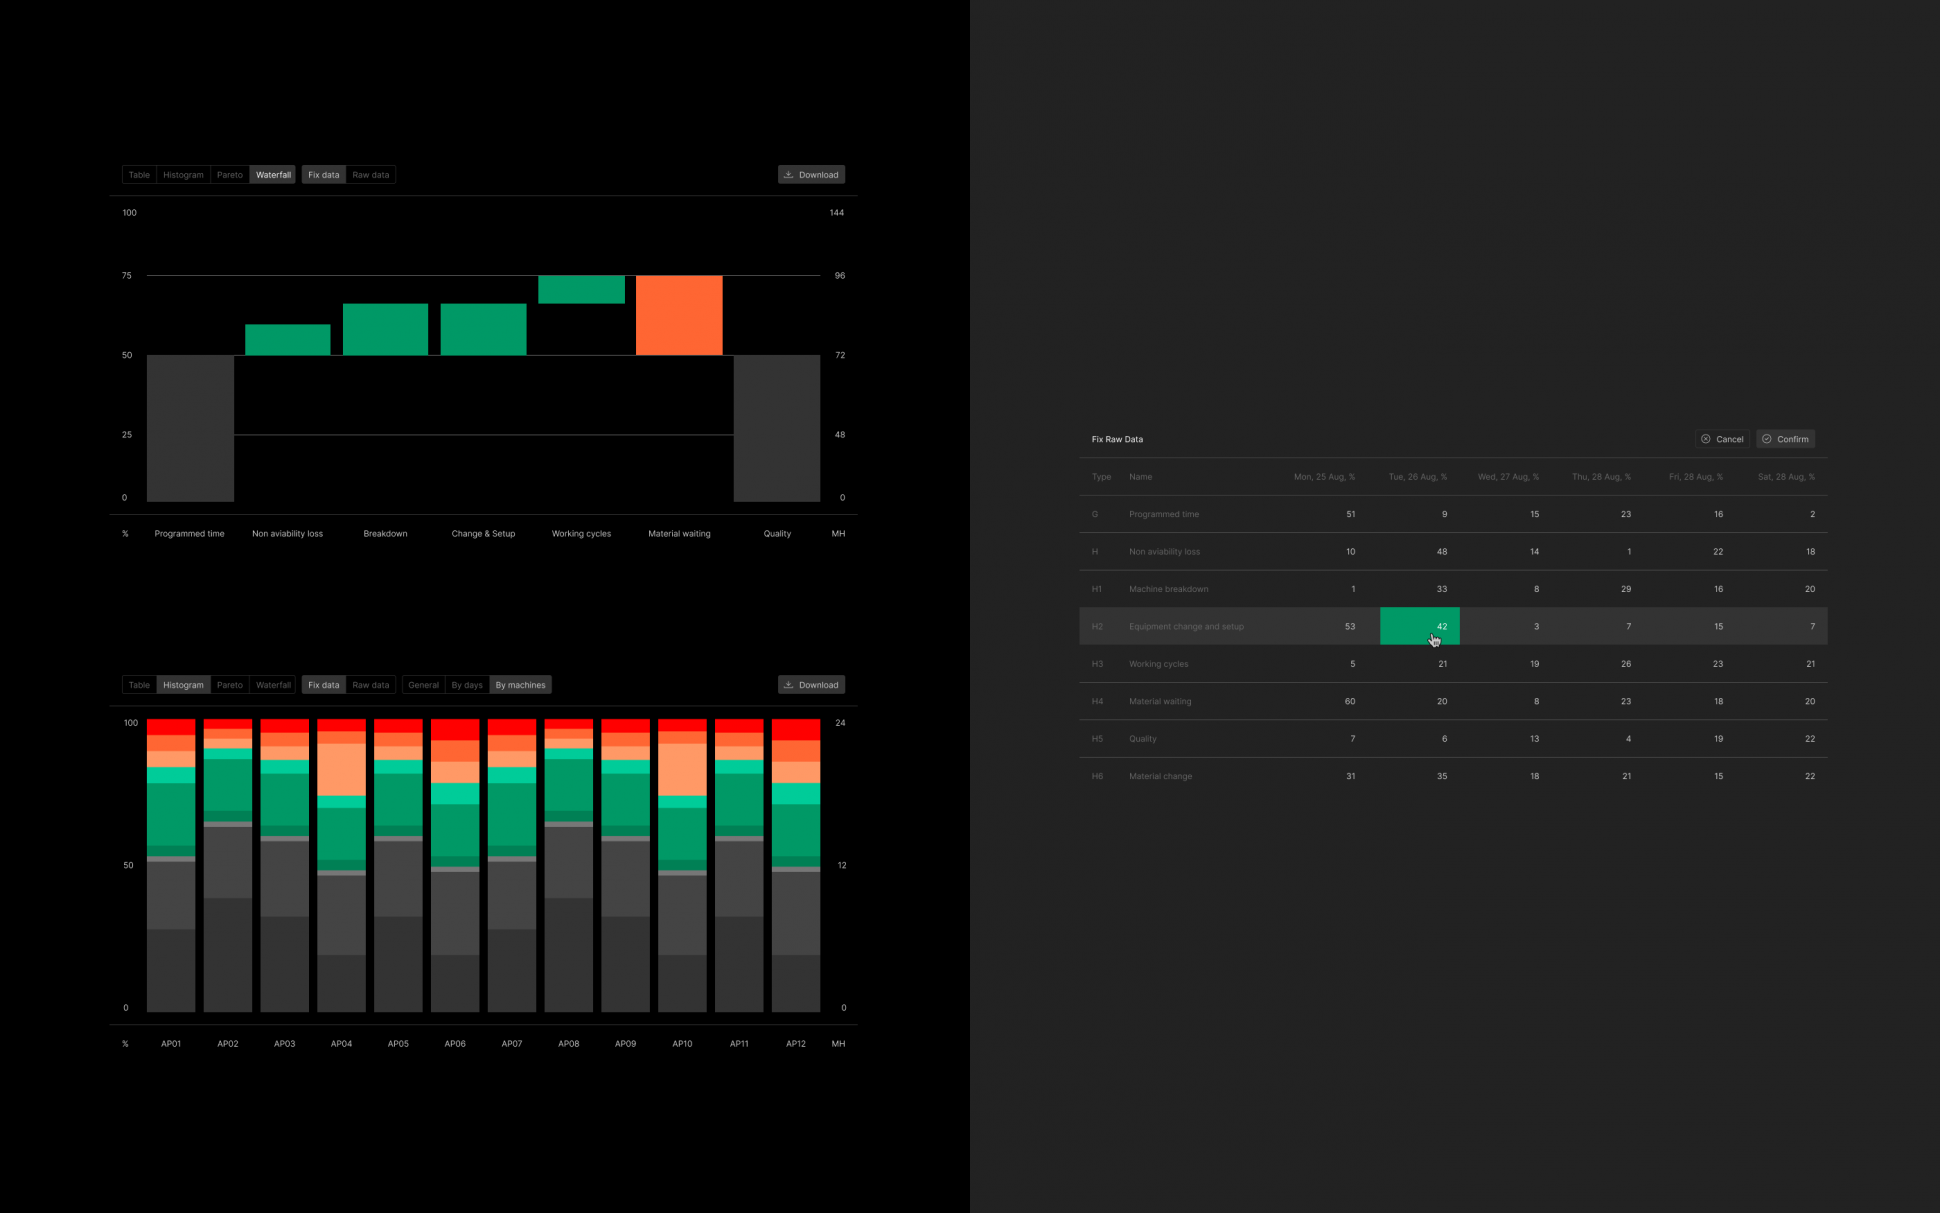
Overall equipment efficiency section
The plant has hundreds of machines that perform millions of operations every day, making it an ideal industrial Internet of Things case study. Data about these operations is integrated into a large common system.
With the help of the OEE section, specialists of various profiles can use the interactive data analytics applications to prepare the necessary reports on the analyses of equipment efficiency: on planning, quality assessment, etc. As a result, top management collects several different reports, and based on their data, receives a general picture of production. At the same time, there can be thousands of such reports— for a shift, a day, months, etc—so clear, simple data visualization is vital.
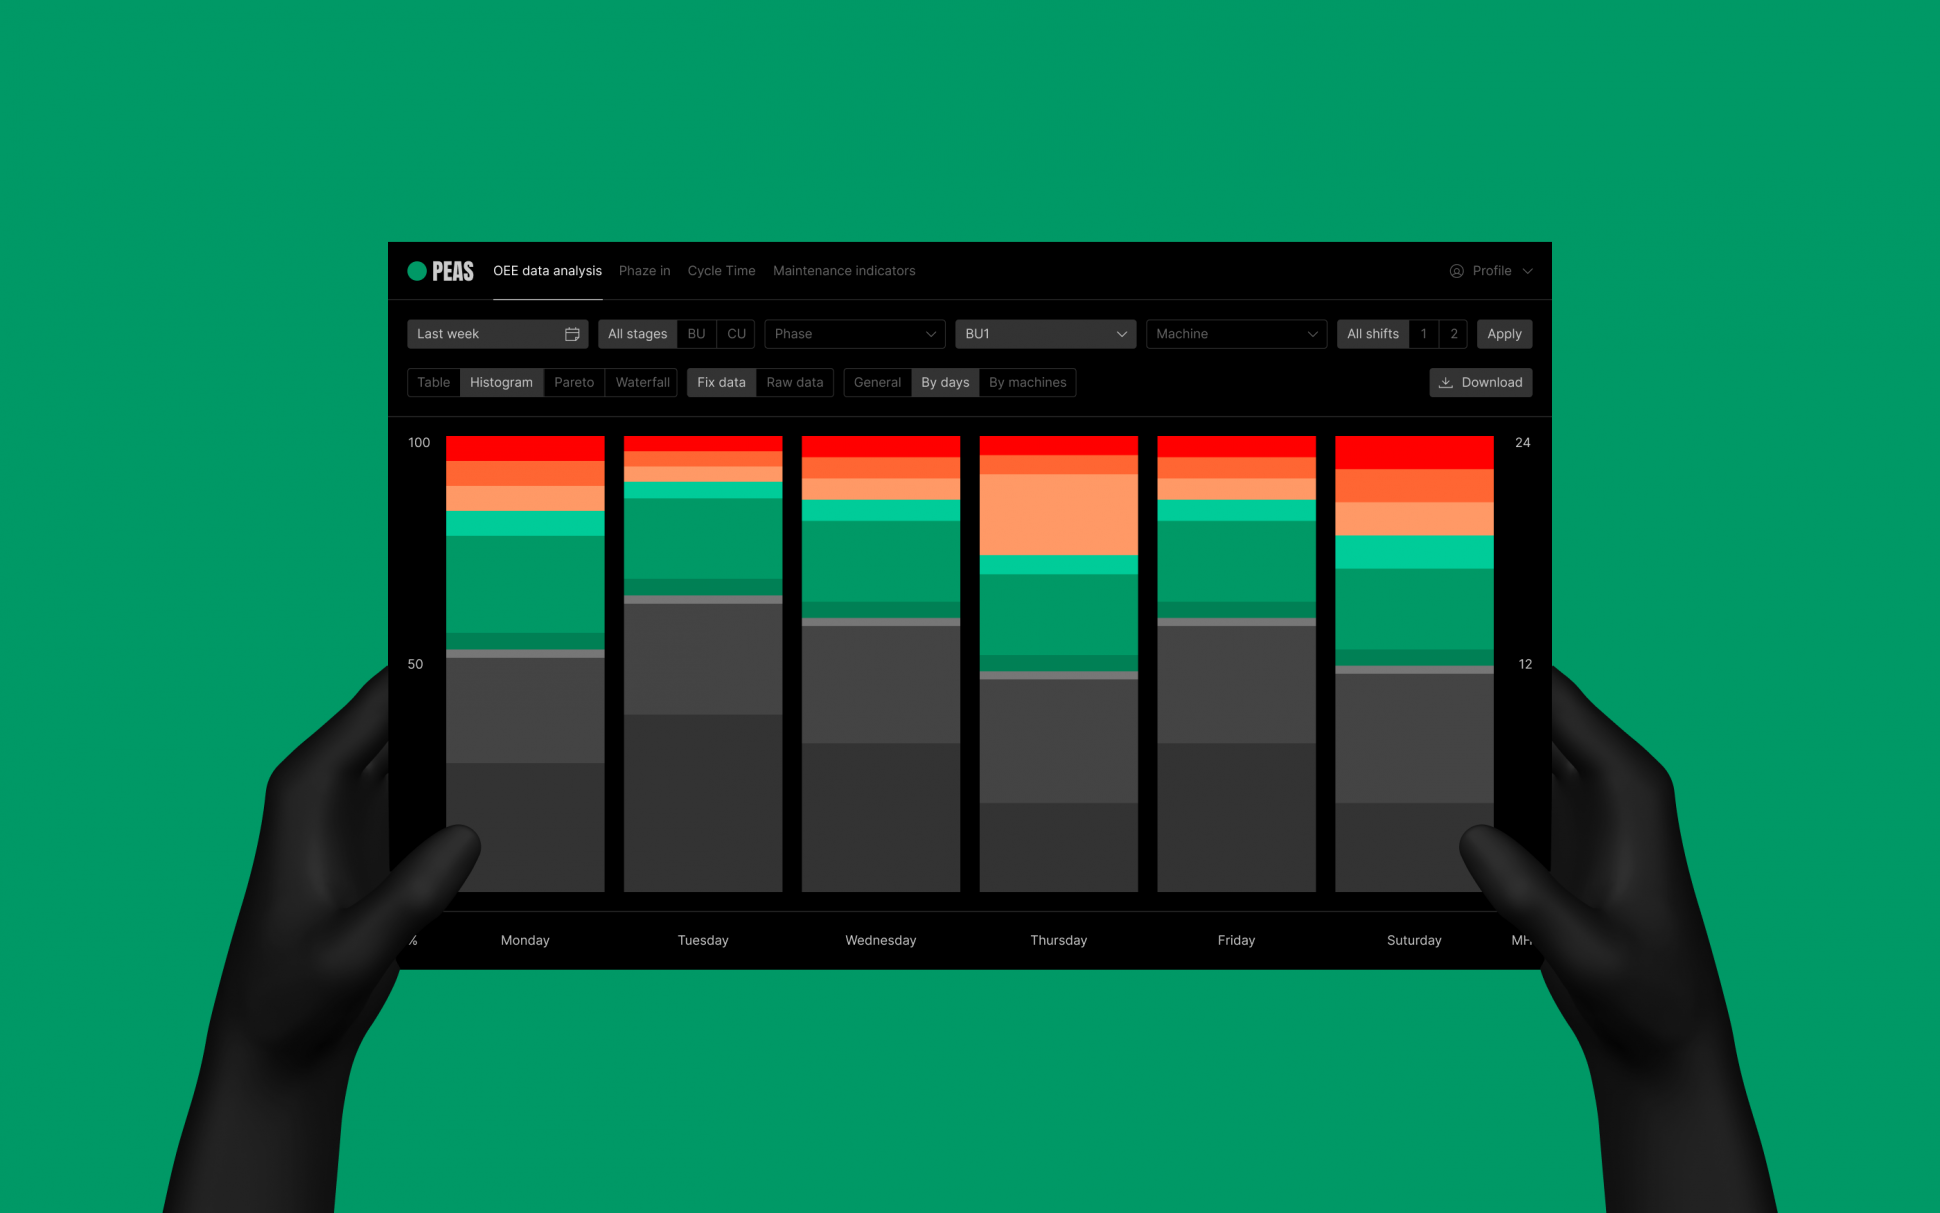
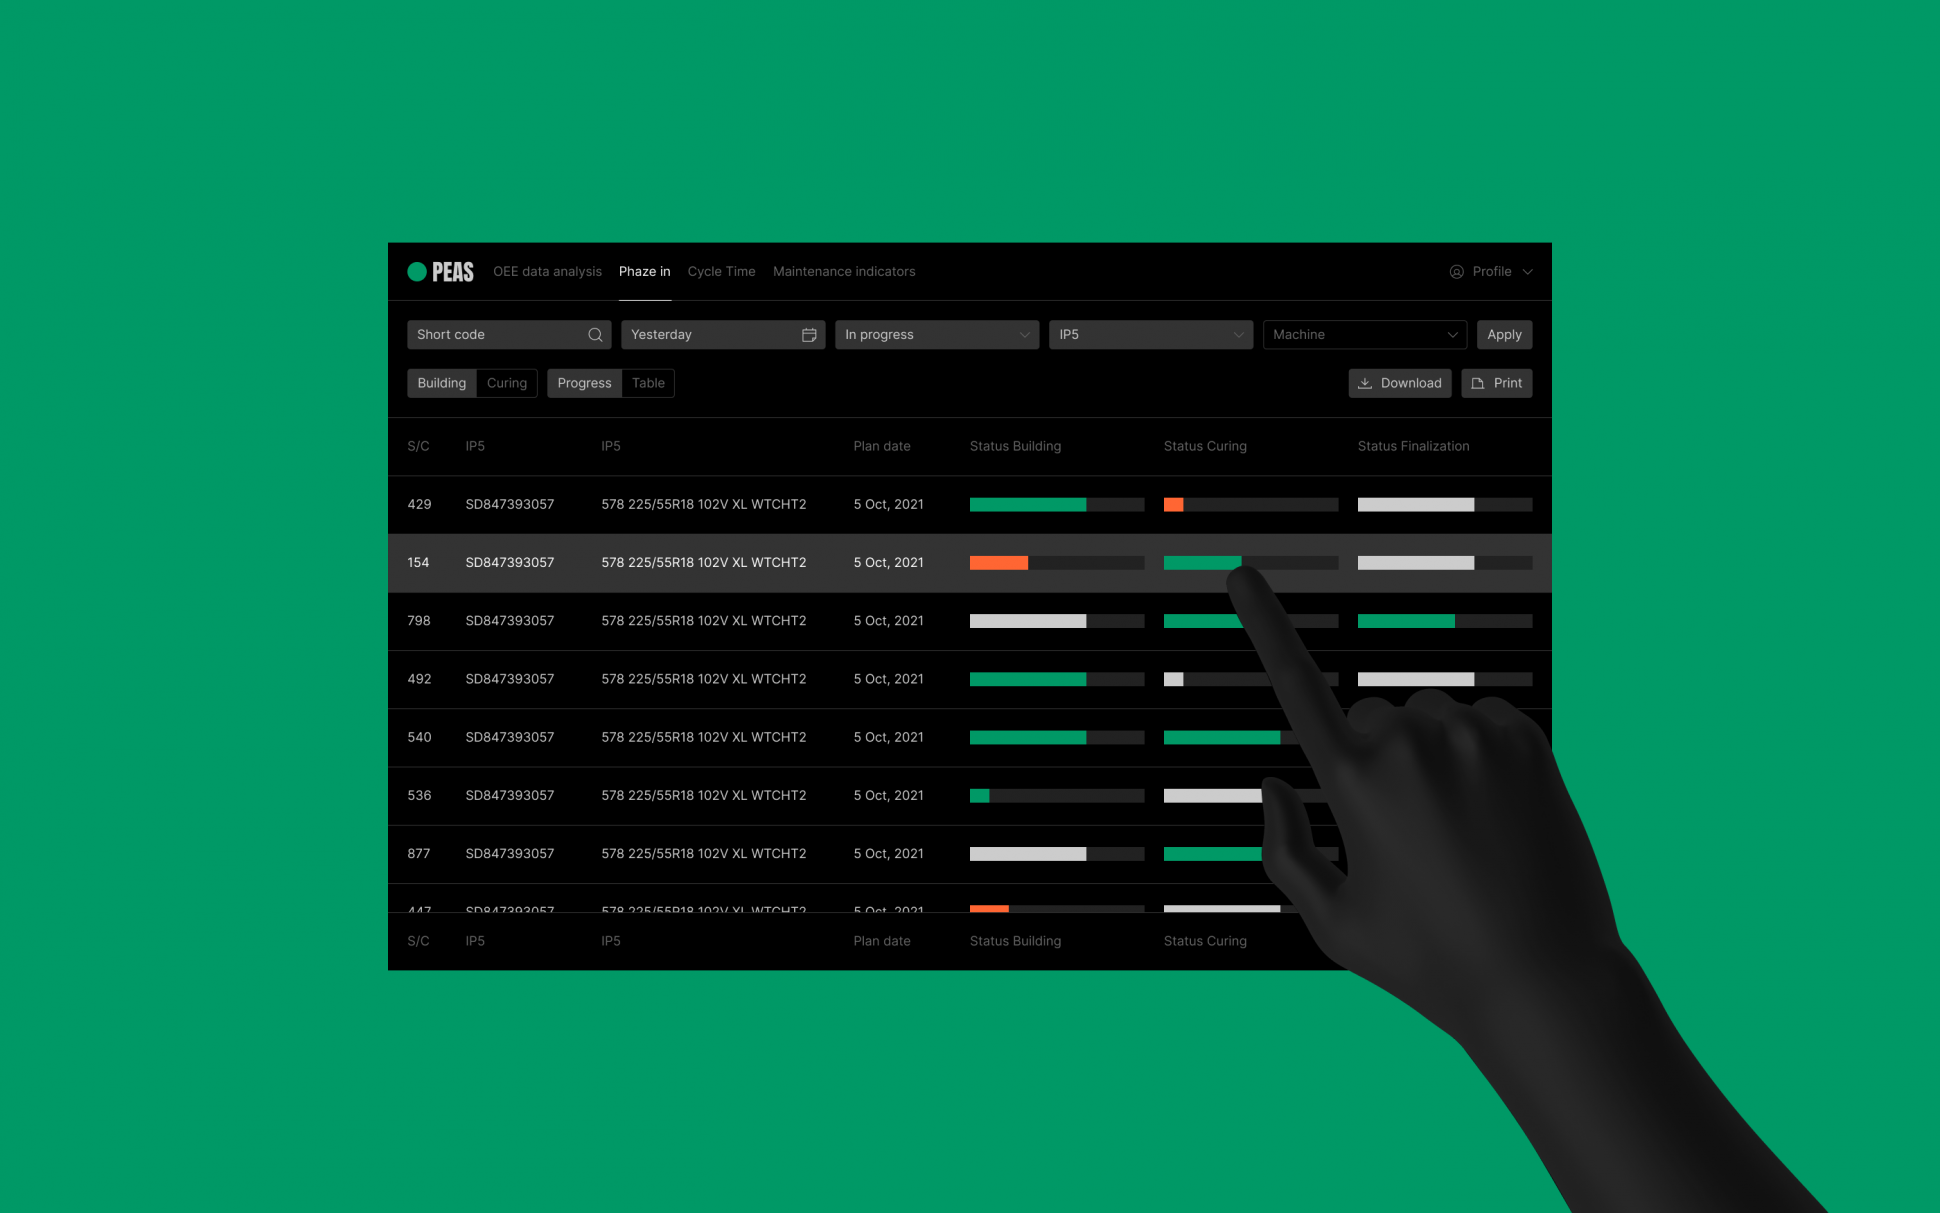
Production planning section
This section helps to control problems at each stage of production. For example, you can look at the processes for a specific type of machine and find out if everything is going according to plan.
Want a community platform for education? Let us build a personalized solution like Peas—contact us today to get started!
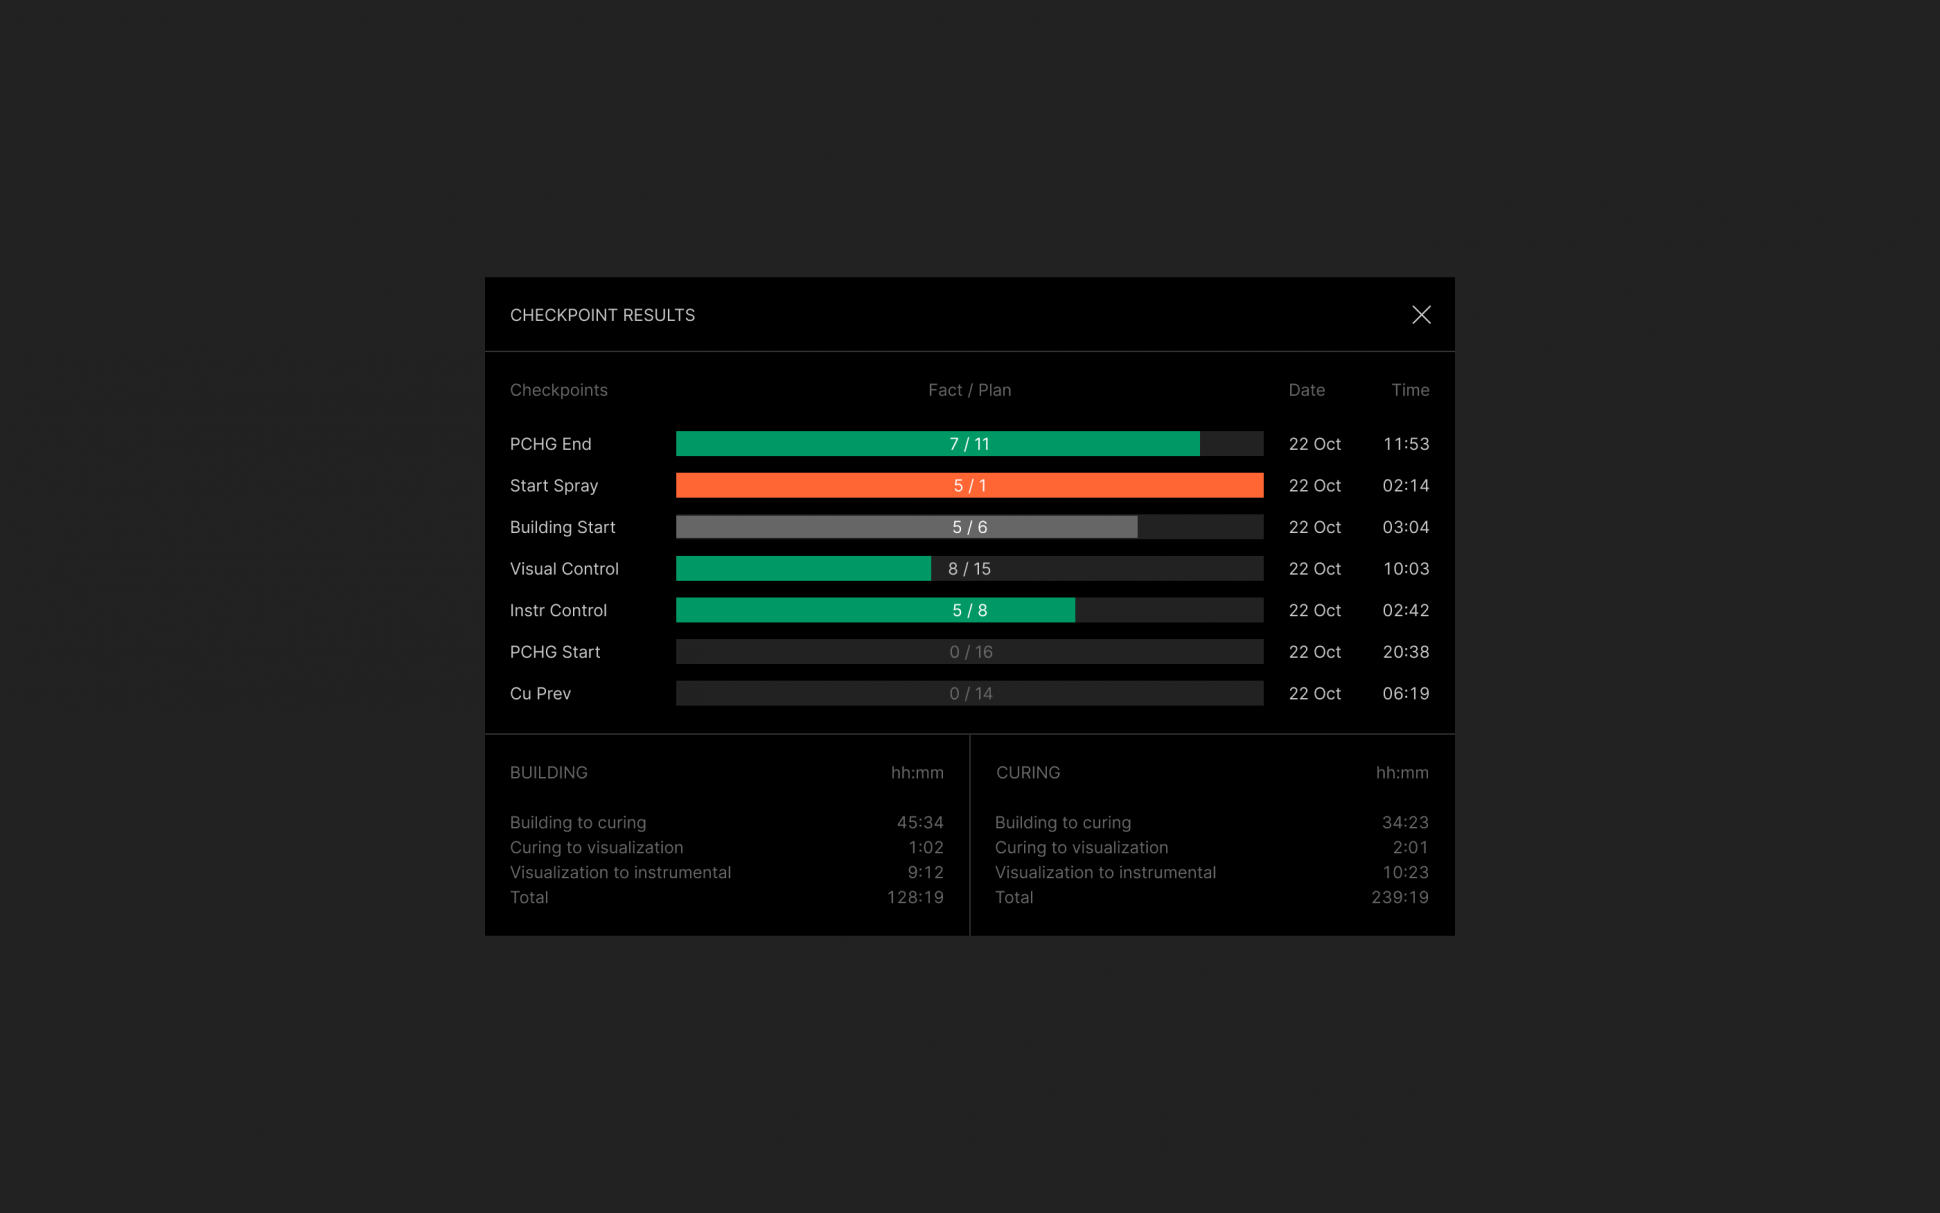
Each stage of production has checkpoints with a specific deadline. In the system, you can see details on whether the process is behind schedule or if it is going according to plan. Color coding in the interface design for monitoring industrial equipment helps users to understand the situation at a glance.
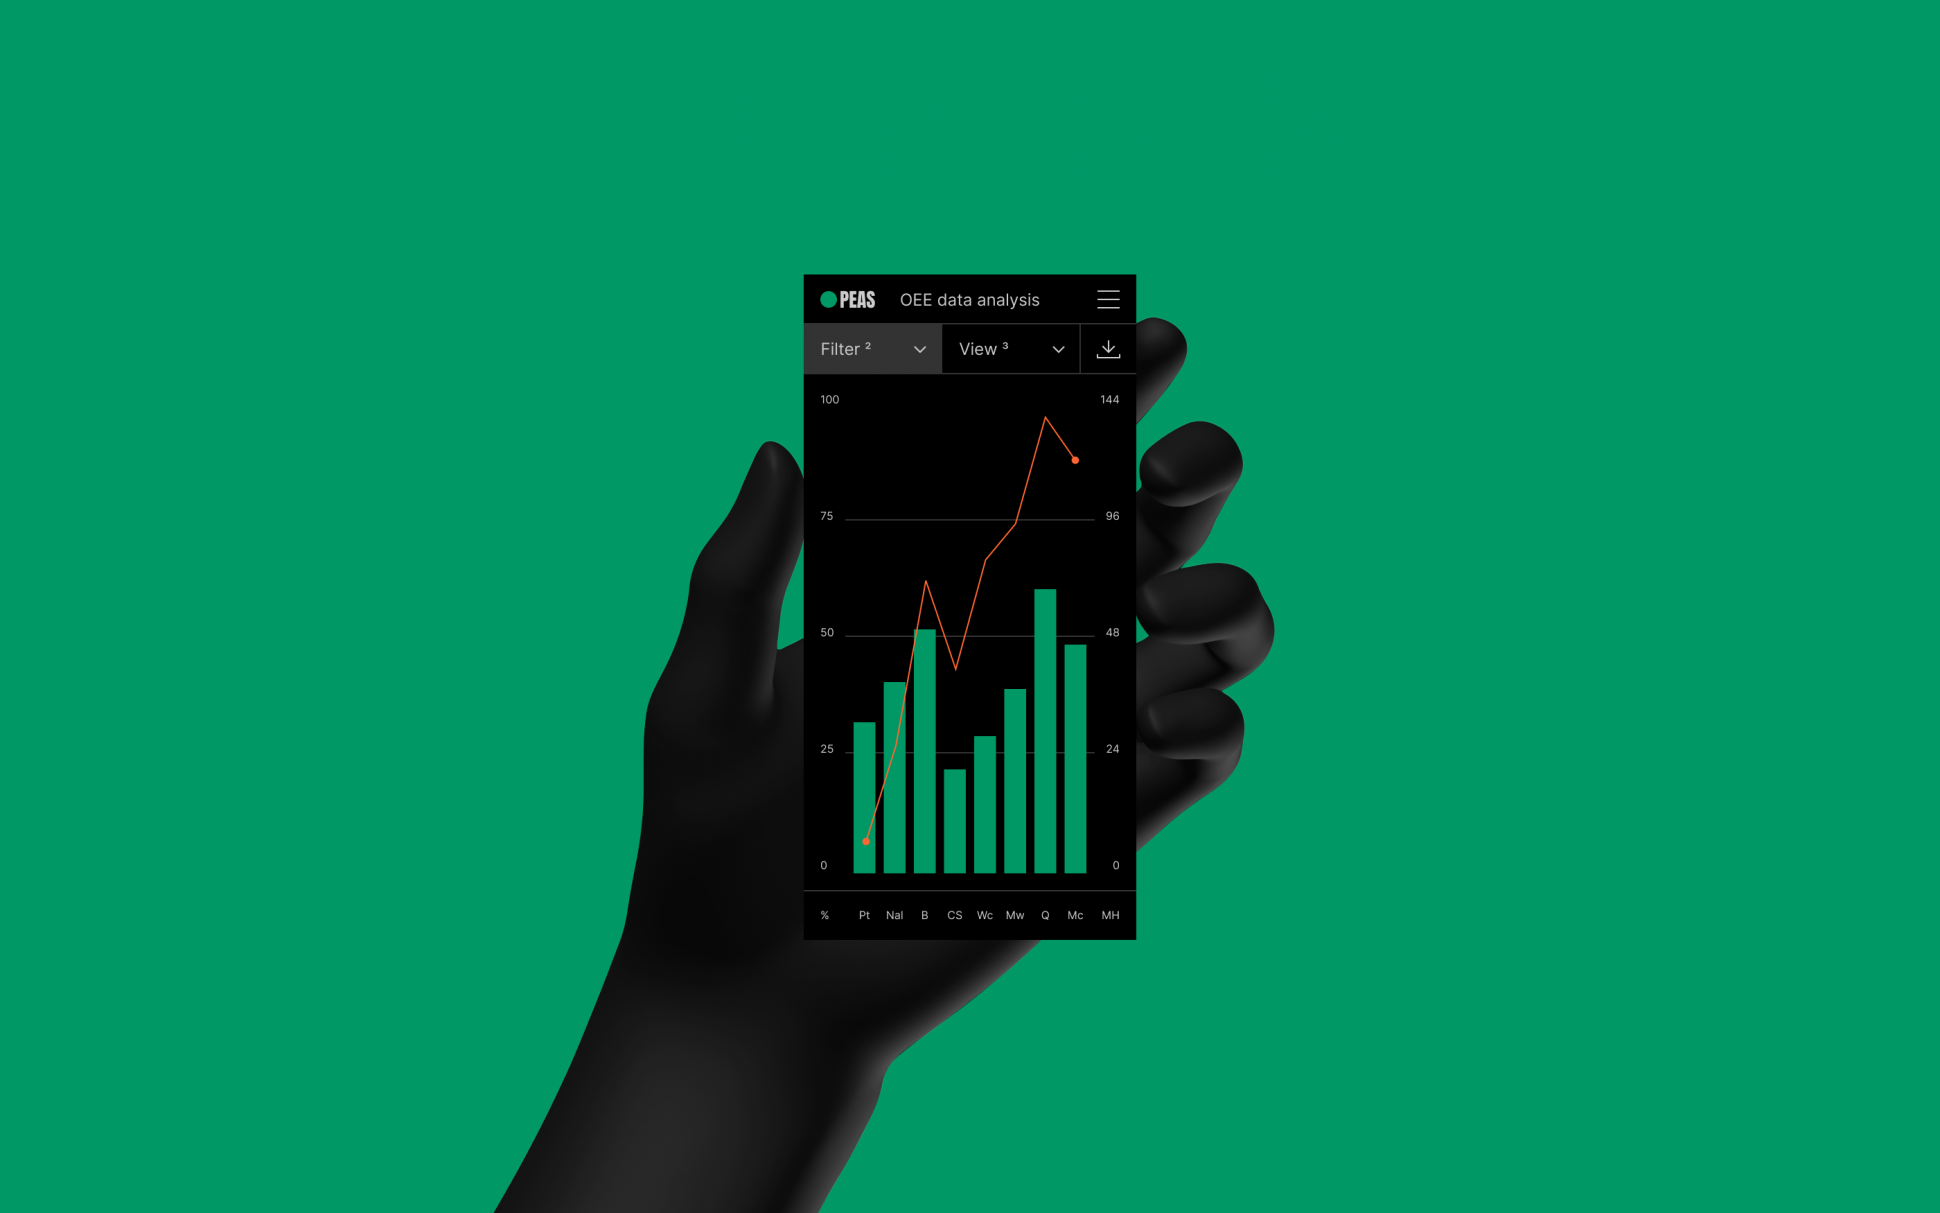
Mobile version
Plant employees do not always work at monitors, and sometimes data is needed in production facilities. So we designed the monitoring system user interface for mobile devices specifically for such cases.
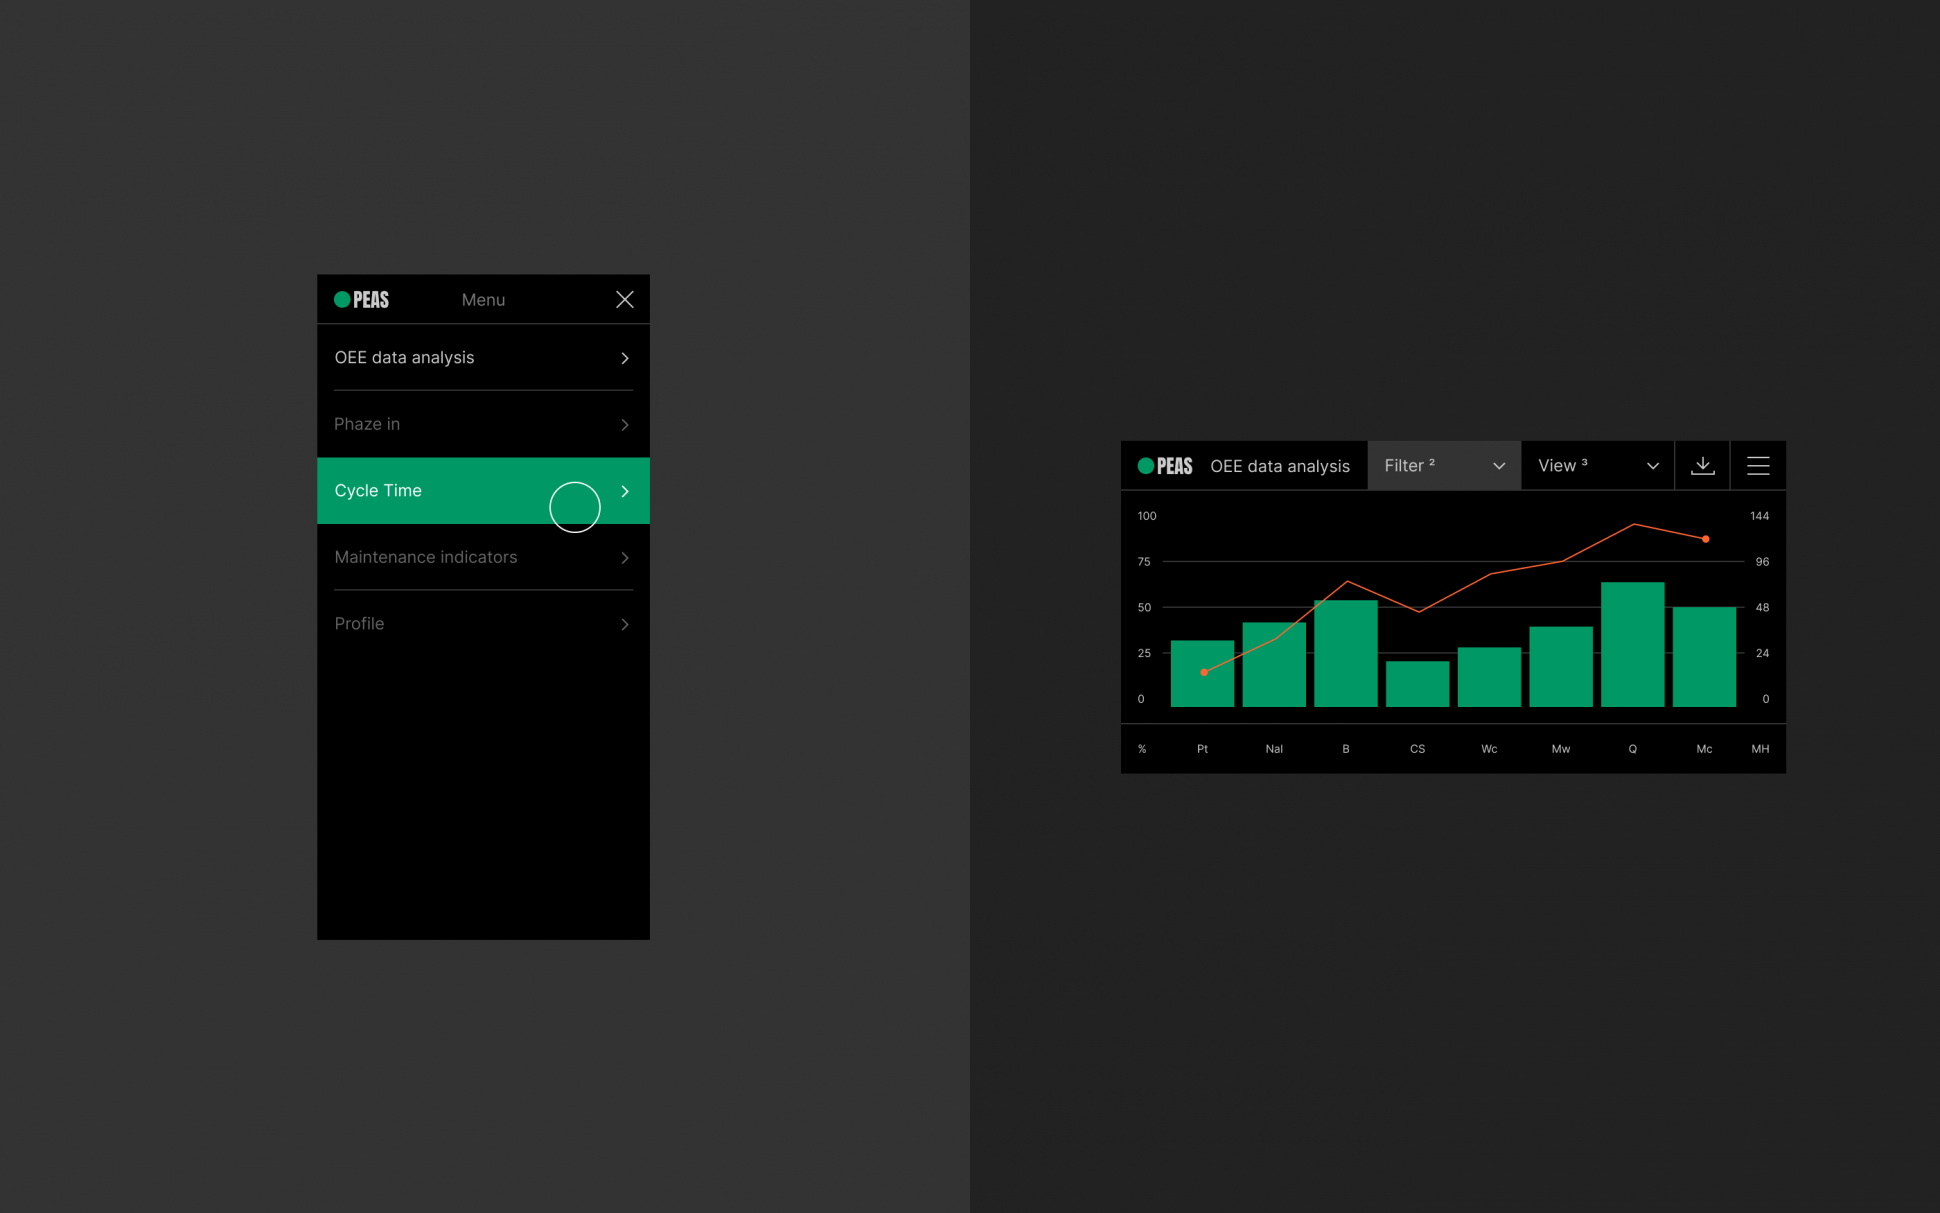
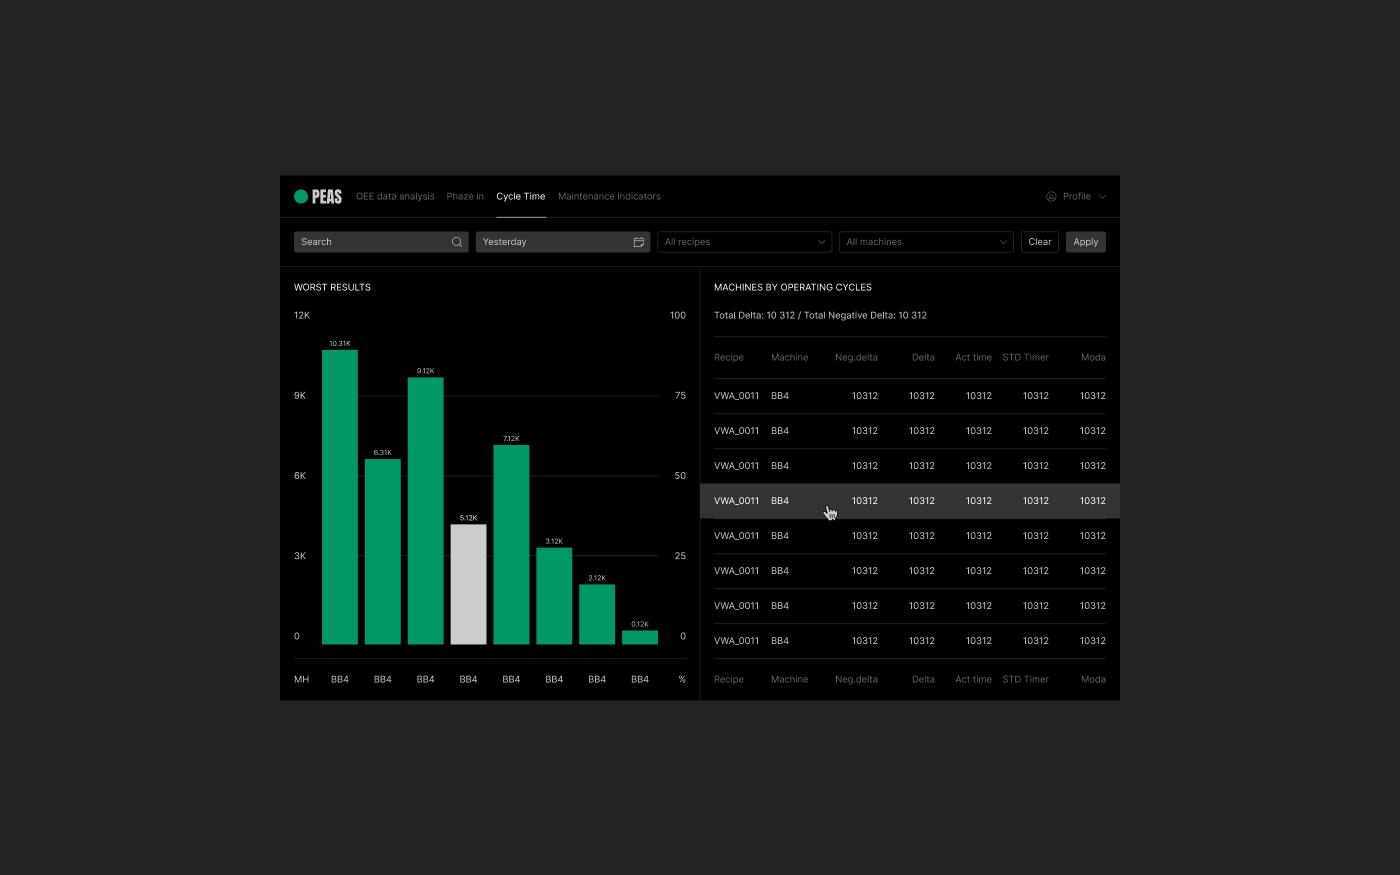
Recipe control section
Most of the workshop is occupied by an industrial mixer, whose task is to mix the necessary components and obtain a homogeneous composition for further production. The composition of the mixtures differs depending on which part of the product they want to produce. For each mixture, the team uses its own technological recipe. Depending on the task in hand, the necessary components are mixed in the machines in a certain order, at the right temperature, under the strict control of the operator.
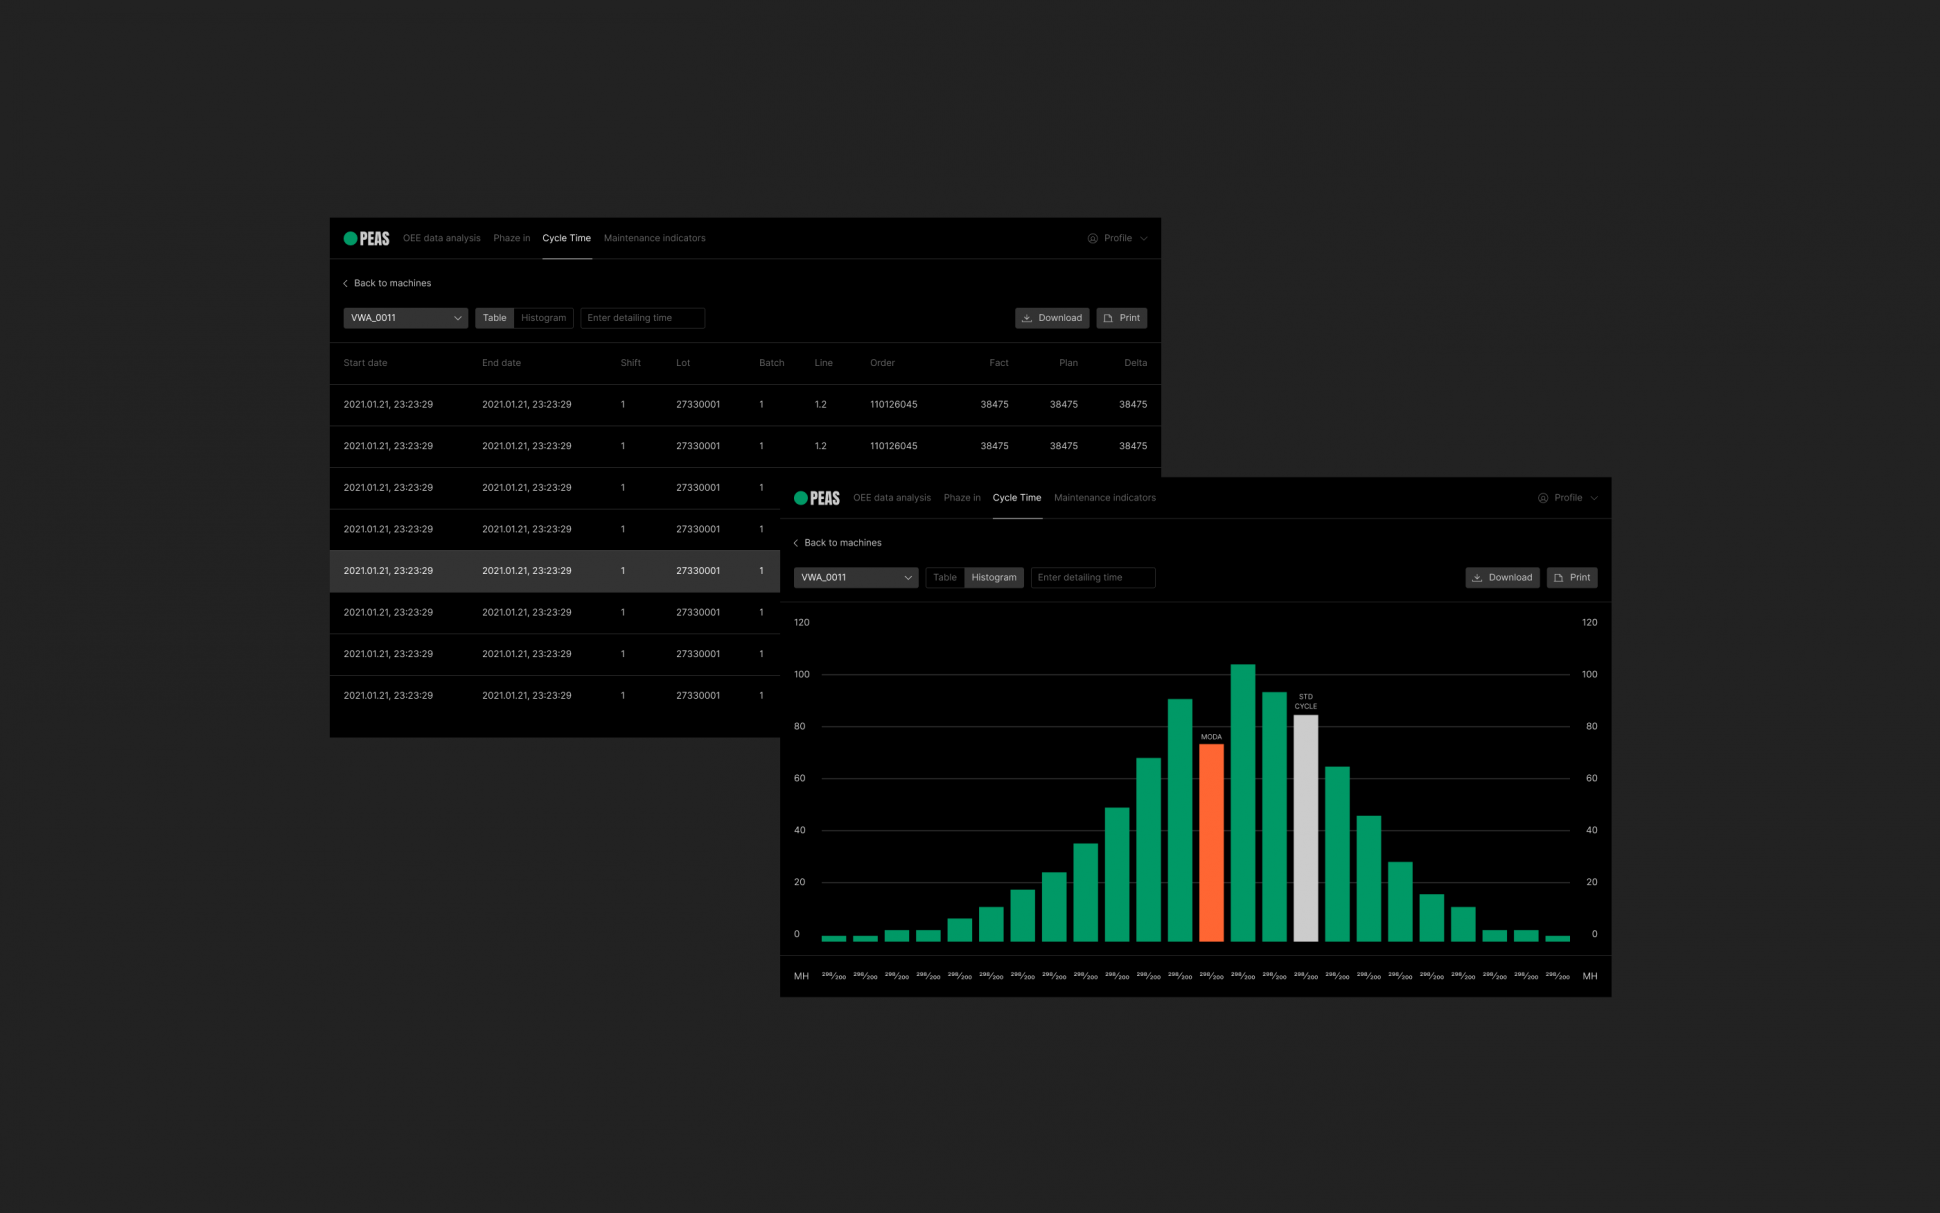
The Cycle Time section helps users see exactly which machines are working with which recipes and how well it works against the production plan.
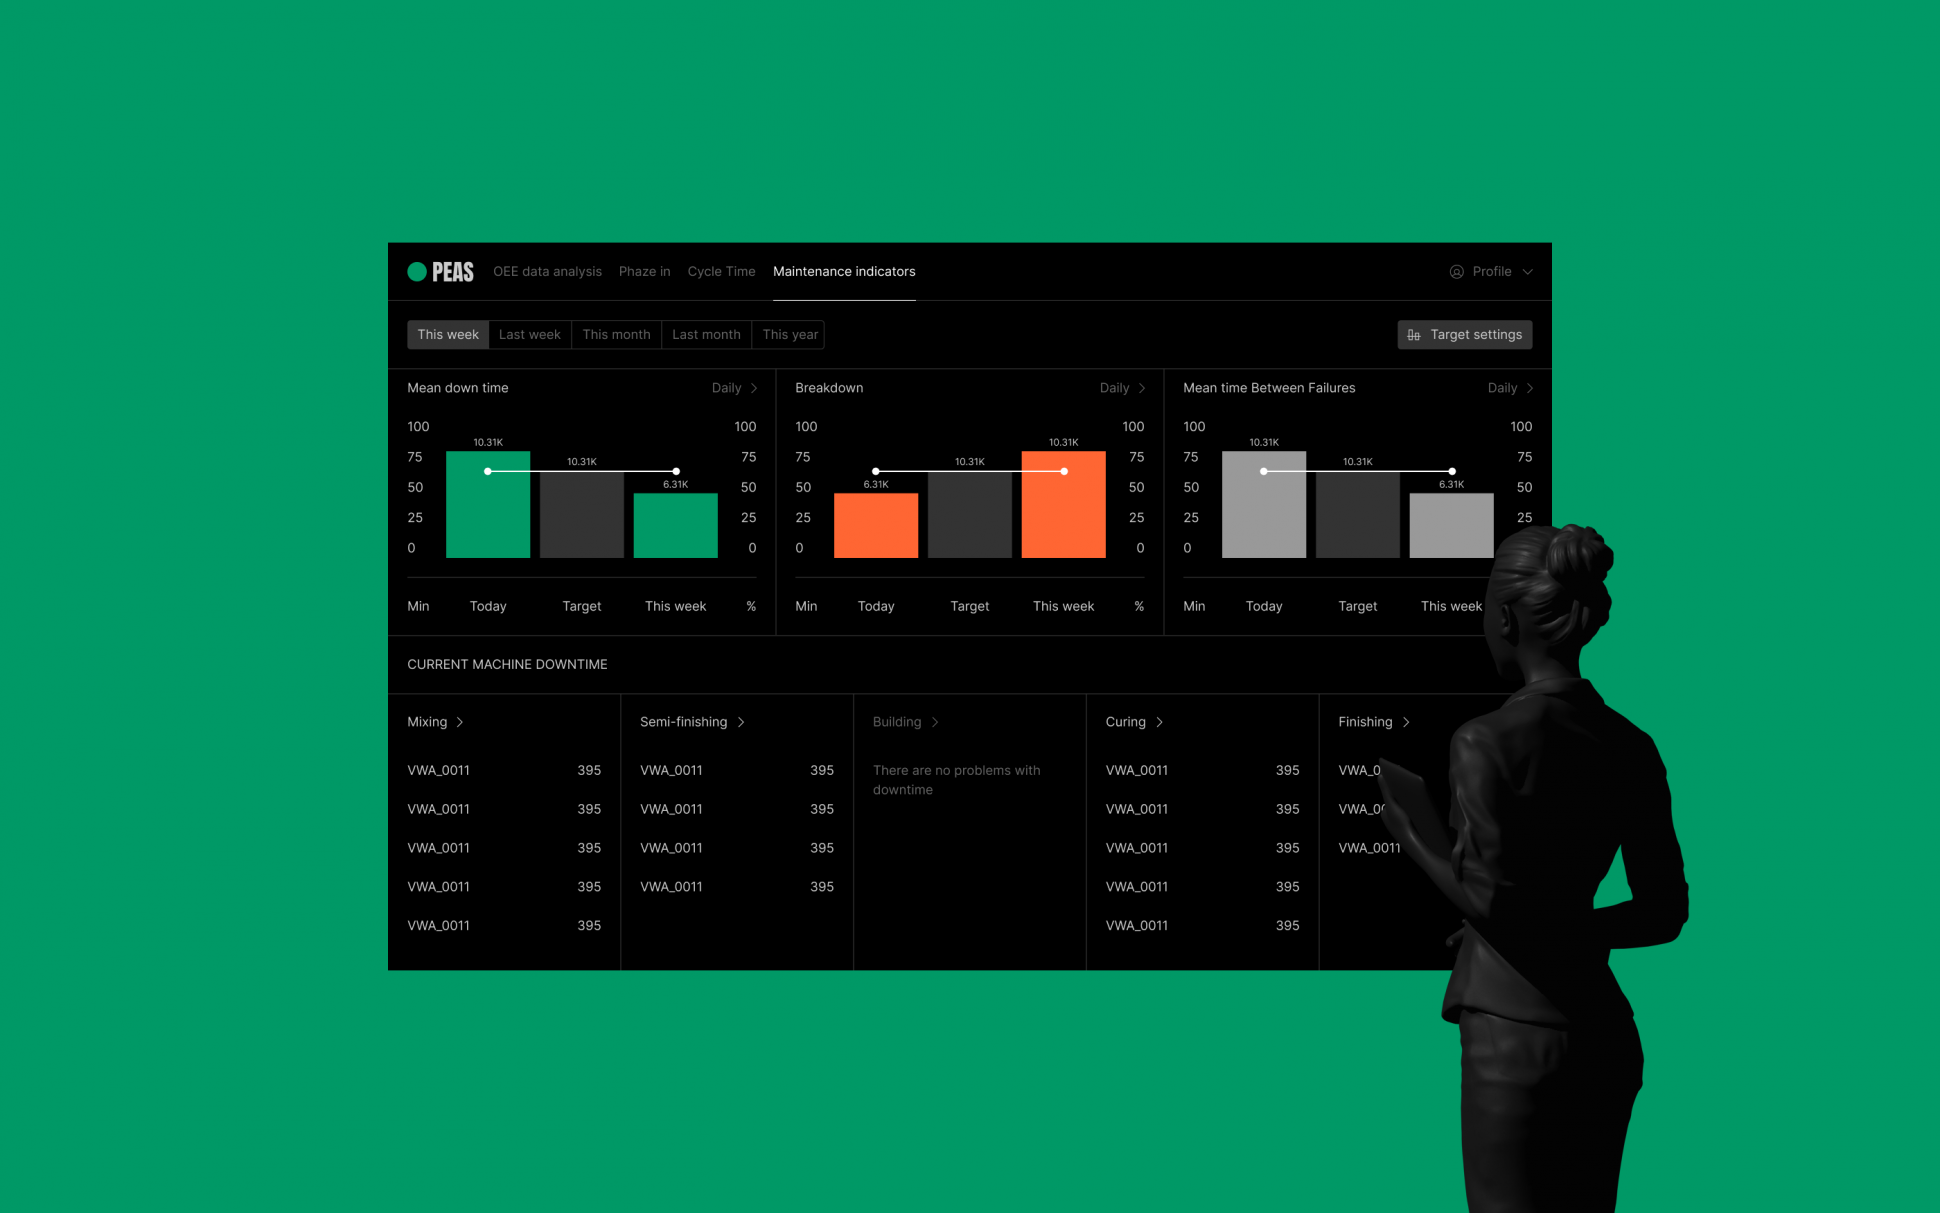
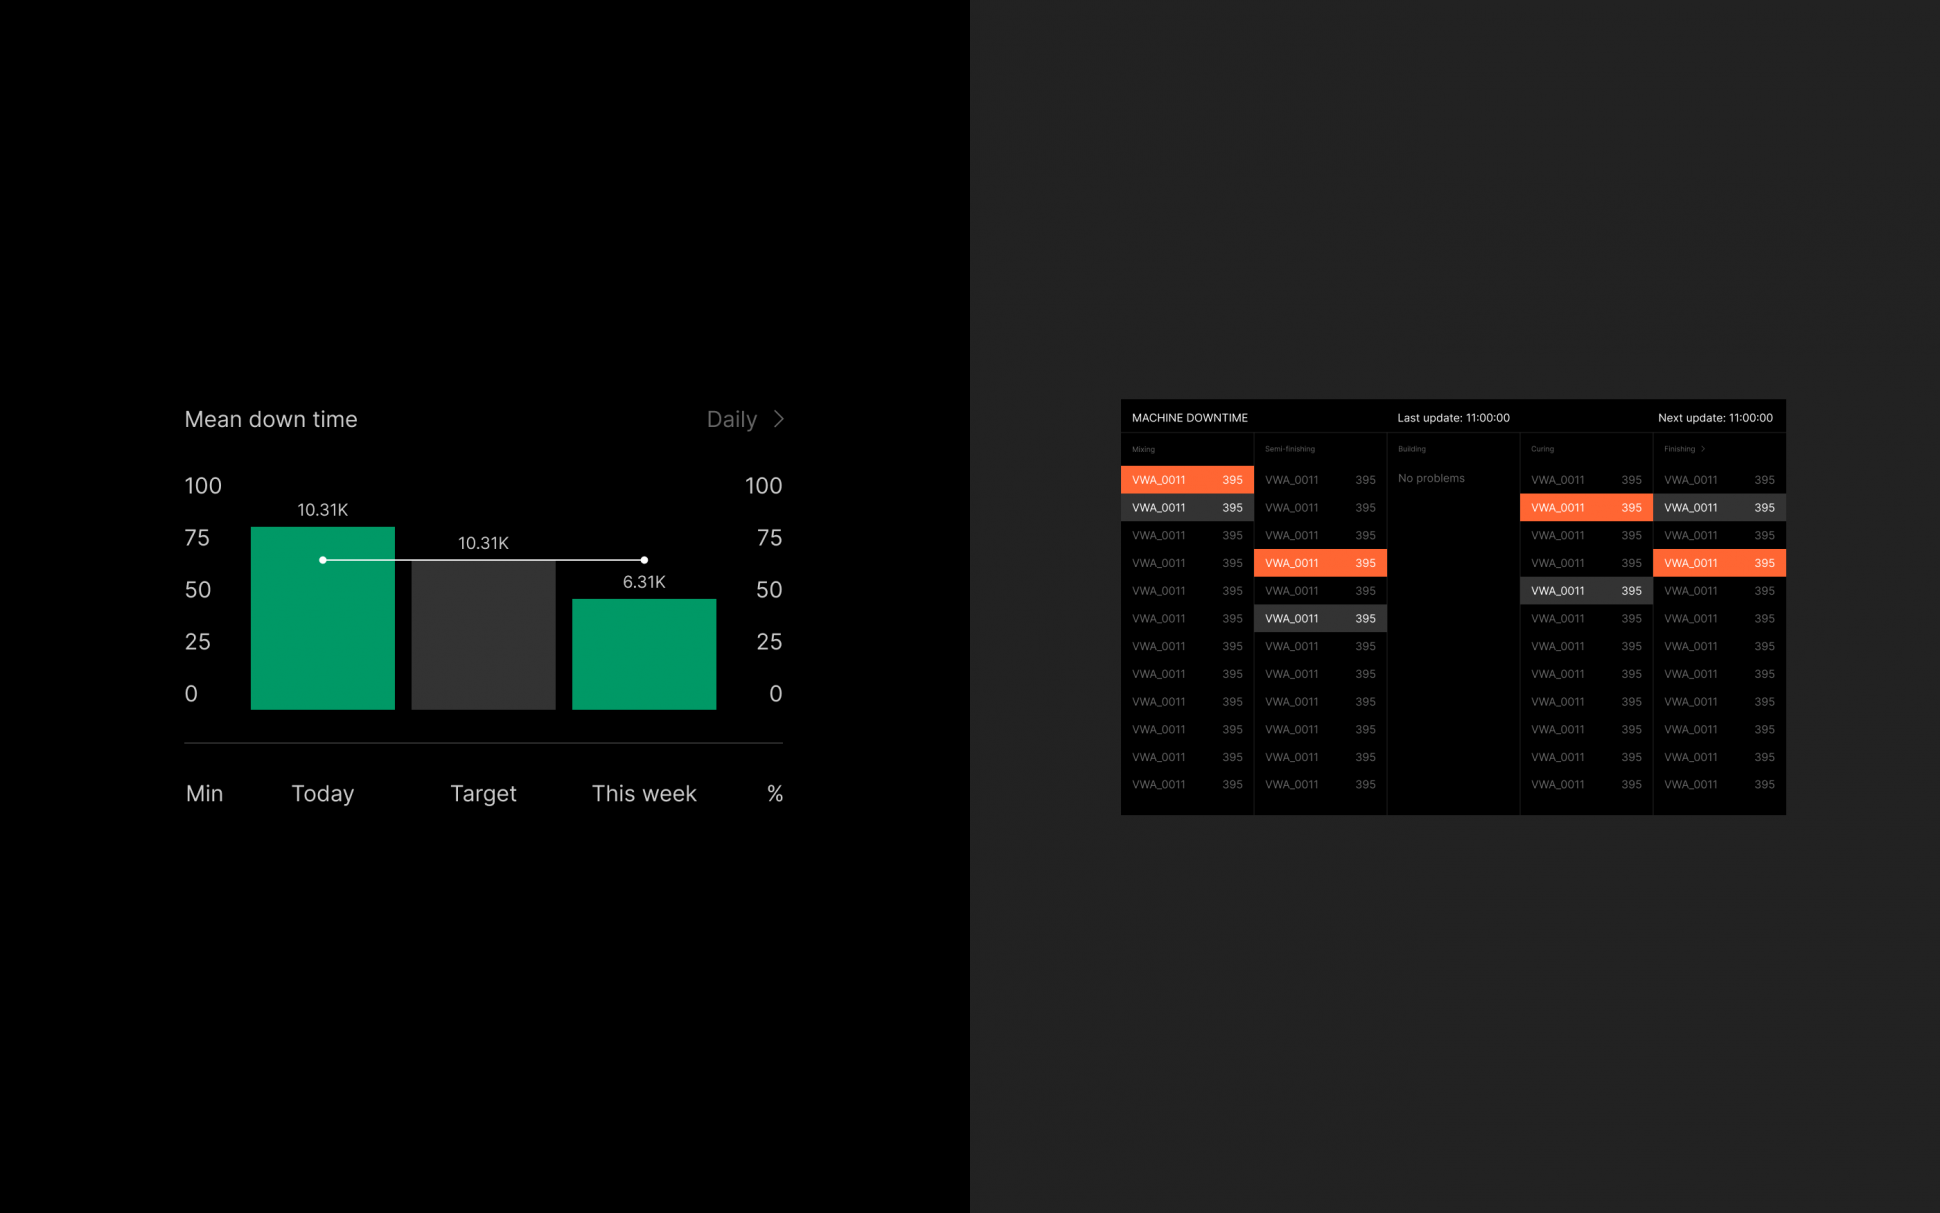
Downtime analysis section
This section utilizes the Internet of Things industrial solutions to help users navigate the operational nuances of maintenance. Workers come here to see how often and for what reasons machines are idle. The data helps them analyze downtime and find out the details: which machines fail most often, which breakdowns are the most common, and which machines have already been idle for a critically long time.
This section is displayed on large screens in production areas as an identifier for operational issues. Operators see statistics in the process of work and adjust their actions depending on new inputs. This is the Industrial Internet of Things in action.
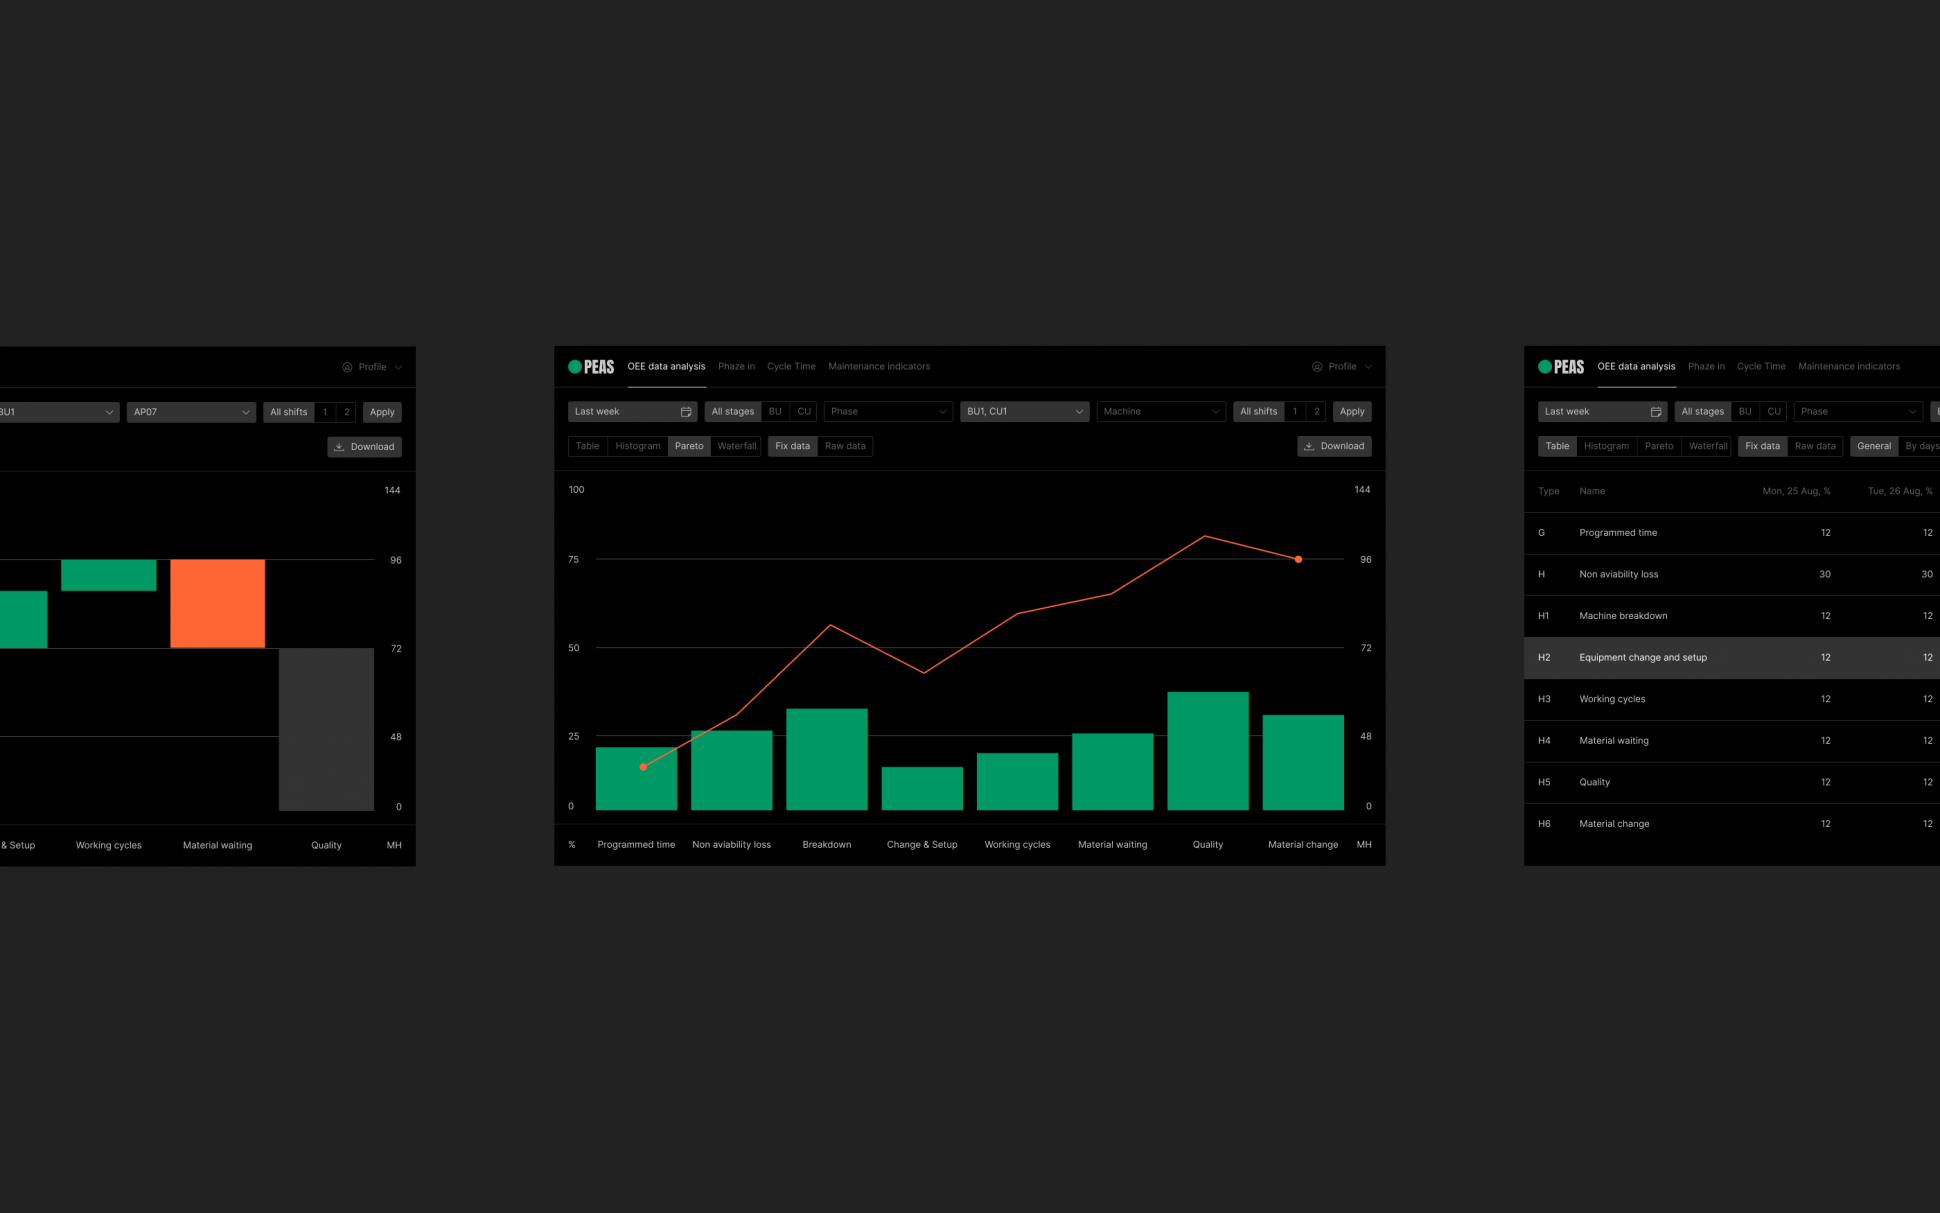
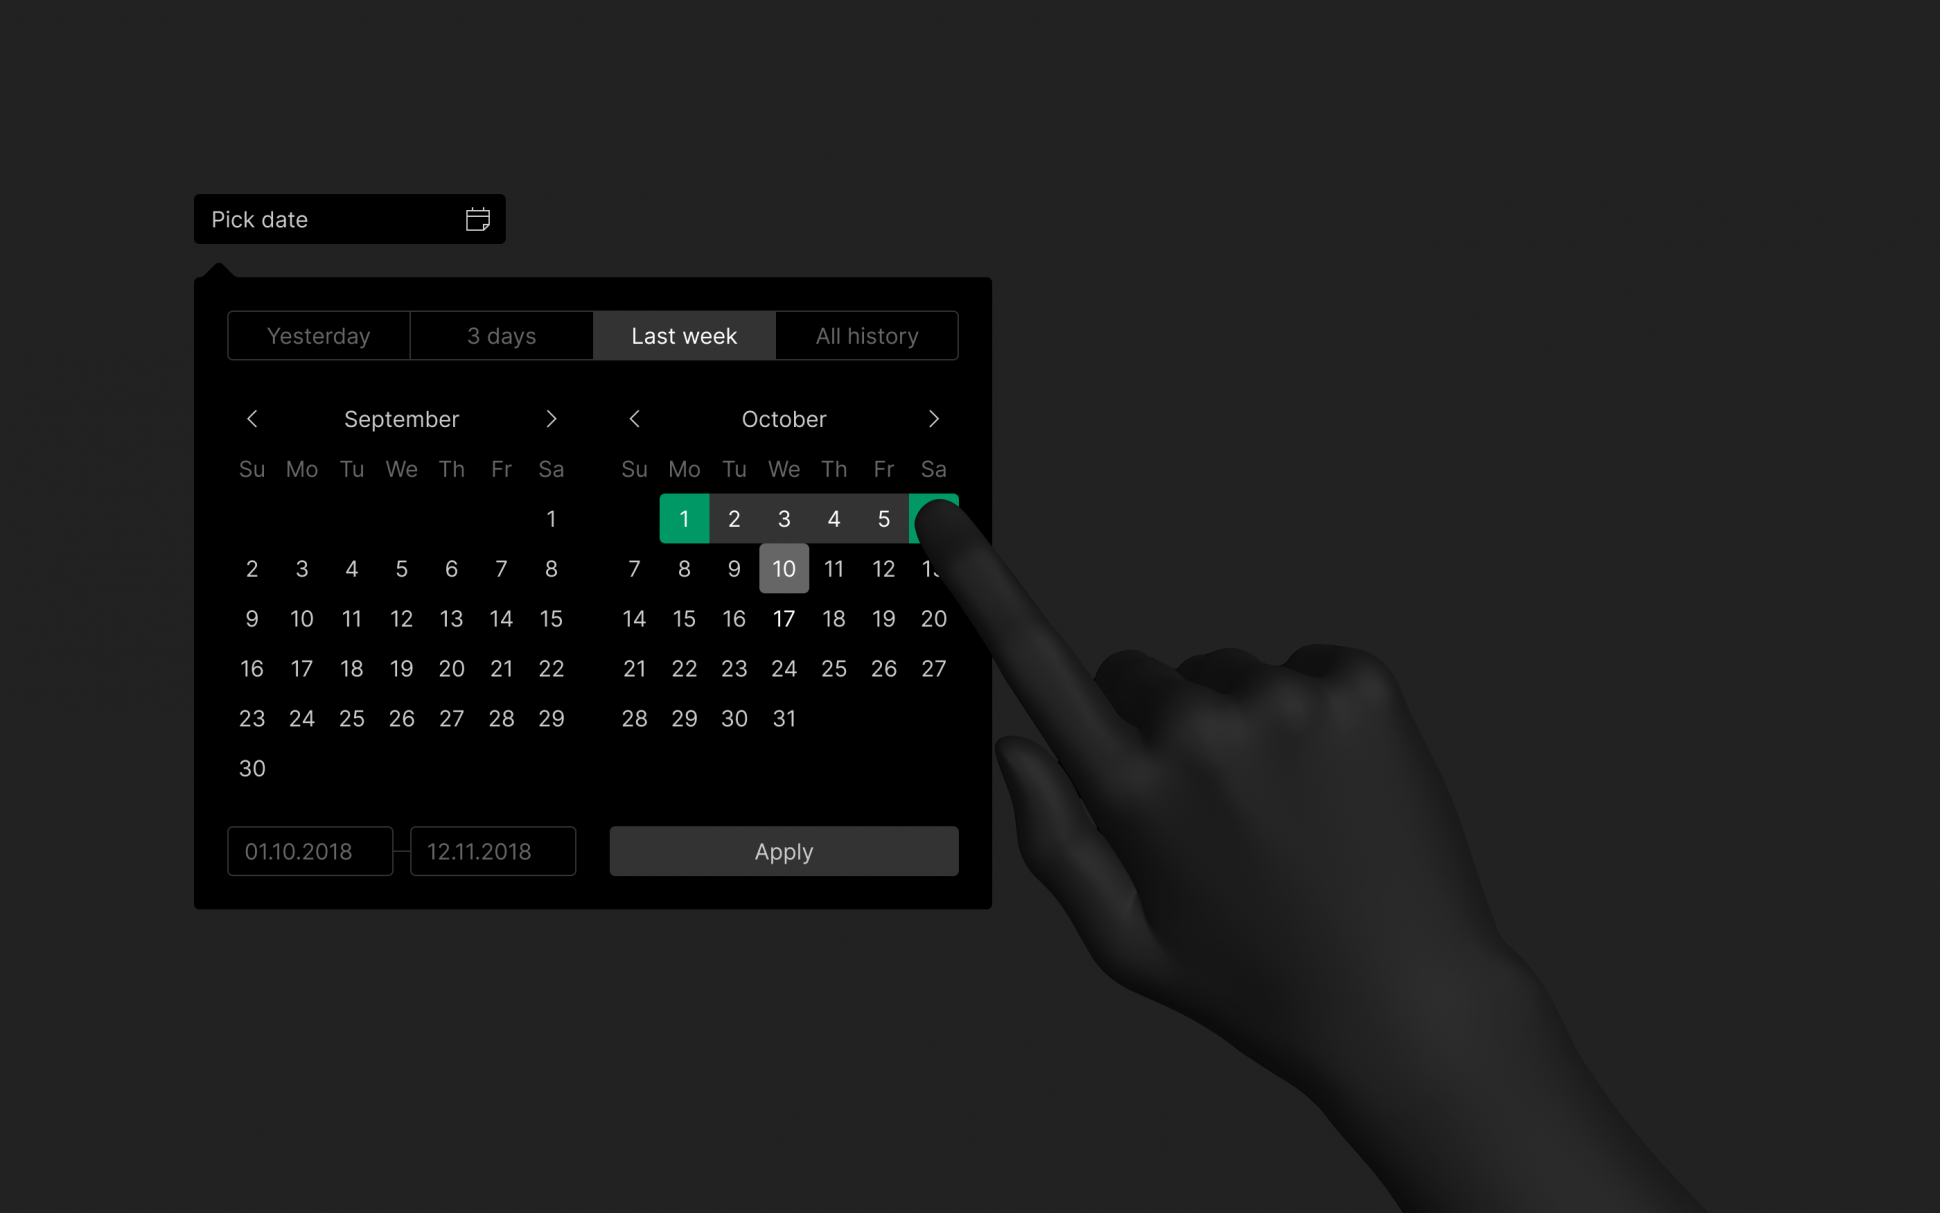
In the process of IoT integration and design of the graphical user interface (GUI) of the monitoring system, we checked with the needs of users—even for small things—and took them into account in the final decisions. For example, most people are interested in data for the previous, the last three days, and the last week. Checking the data for these periods is part of the responsibility of the employees who maintain the efficiency of the machines. So we made the most popular periods available for quick access, so they can view the required reporting with fewer clicks.
Such tasks are a rare opportunity to plunge into the world of industrial aesthetics. Minimalism, the realm of function, airport displays, instructions, dashboards—industrial aesthetics has its own rules and reference points. This is especially true for color coding. In the technical color system, it is customary to immediately report the level of danger or a positive course of affairs—this is ergonomic design of interfaces. In our system, we followed the same approach. We immediately focus on problems, mark completed processes in green, and mark current processes that do not require prompt intervention in gray.